Create Line Charts with Python
This bot creates a line chart from the data in a CSV file
Top Benefits
- Create charts instantly for different data sets
- Flexible to work with any number of columns
- Creates multi-color charts
Tasks
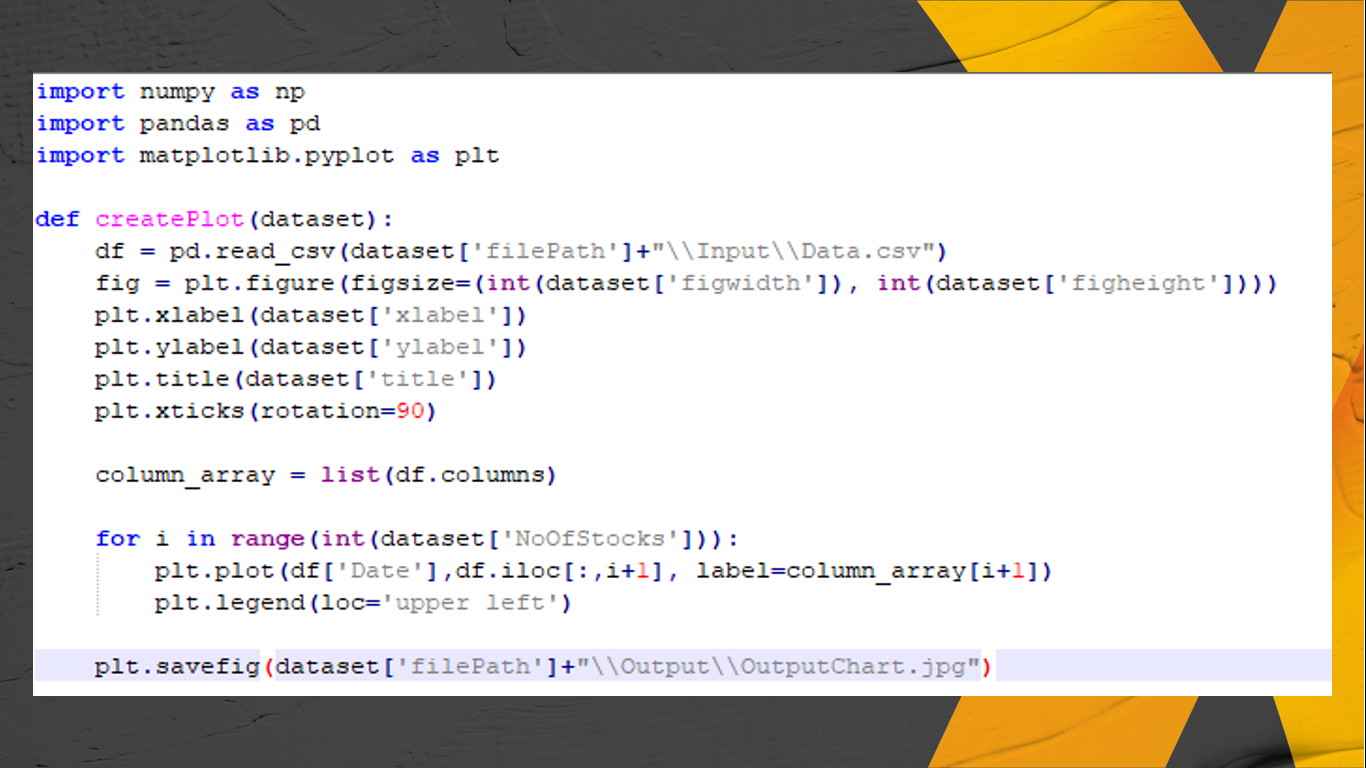
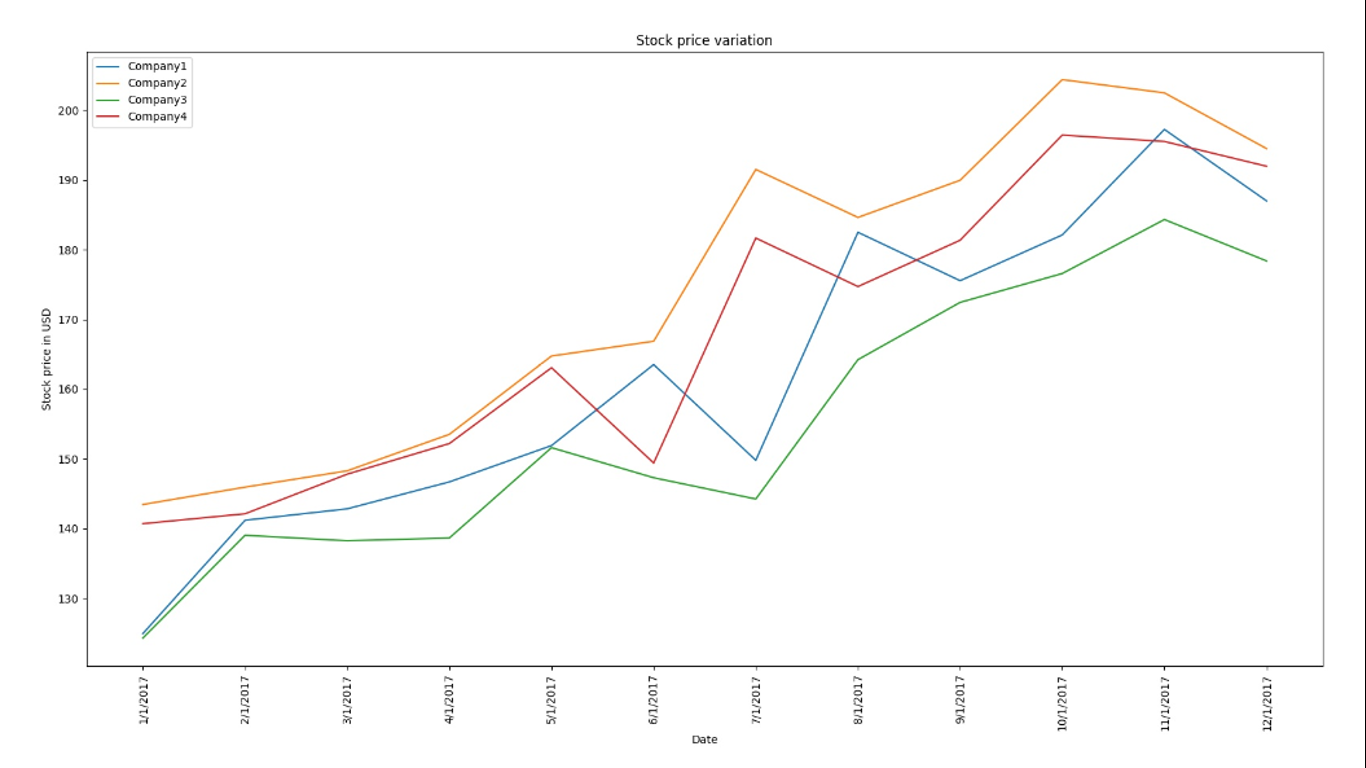
- Creates line charts from data in a CSV file
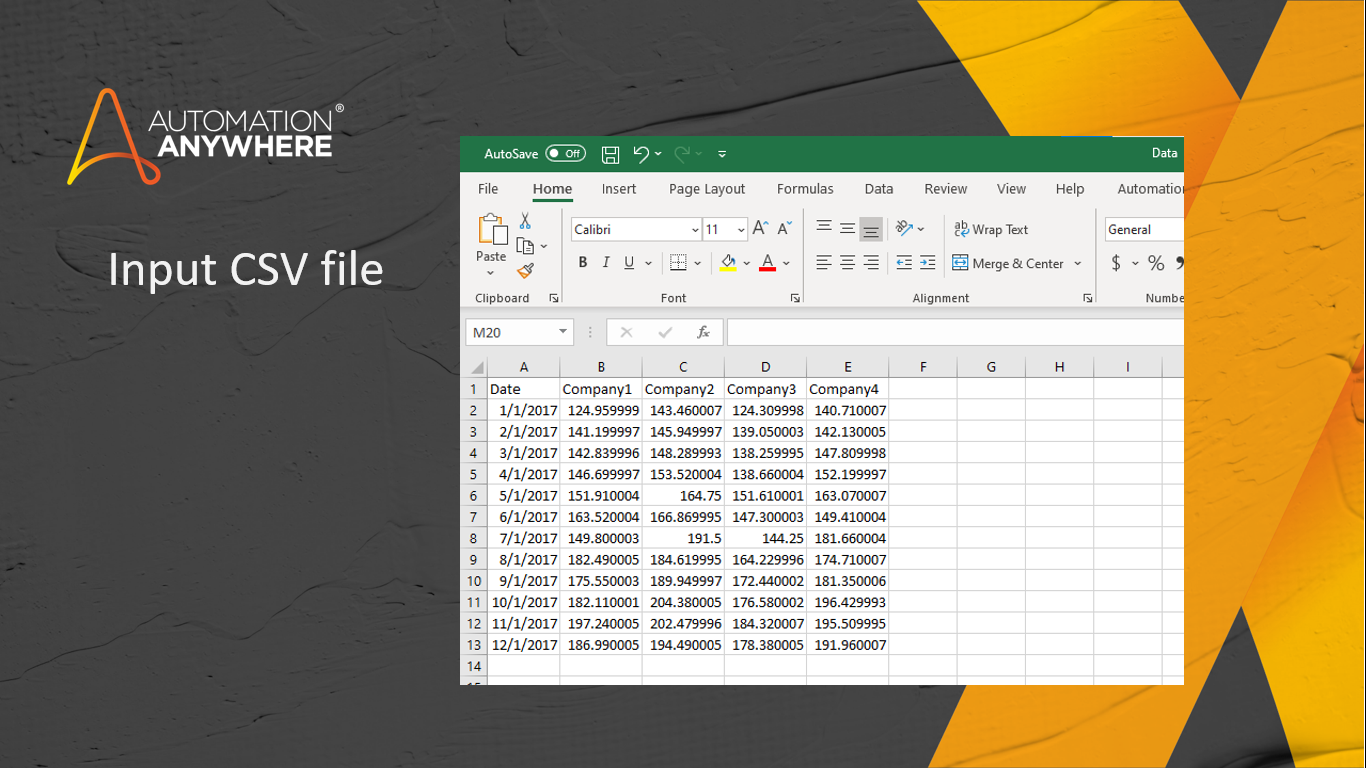
Input: Enter the data in a CSV file. In the Python code file, we have considered creating line charts for stock prices on different dates. You can download the CSV file from this link.
Use Cases:
• Analyze financial data on a daily, weekly, or monthly basis.
• Plot employee productivity across sprints
• Analyze sales data to see the trends.
Output: Line chart saved in JPG format

Success
The download of Create Line Charts with Python will begin shortly.
In your Control Room, use the ‘Import’ button to load the downloaded file into your Automations.
Free
- Applications
-
- Business Process
- OperationsRPA DevelopmentSales
- Category
- InsightsProductivity
- Downloads
- 58
- Vendor
-

- Automation Type
- Bot
- Last Updated
- May 25, 2021
- First Published
- January 19, 2021
- Platform
- Automation 360
- ReadMe
- ReadMe
- Support
-
- Community Support Only
- Pathfinder Community Developer Forum
- Agentic App Store FAQs
- Bot Security Program
-
 Level 1
Bot Security
Level 1
- All automations on Agentic App Store have passed a malware scan.
Bot Security Program
Automation Anywhere Bot Security is the APA industry's first of its kind bot security framework. In partnership with cyber security experts, Bot Security encompasses four (4) progressive levels of security designation. All automations including those built in-house or procured from Agentic App Store, can now be deployed reliably with secure automation development practices in alignment with prevailing Confidentiality, Integrity, and Availability (CIA) cybersecurity principles and best practices. View full Bot Security details.
See the Bot in Action
Setup Process
Install
Download the Bot and follow the instructions to install it in your AAE Control Room.
Configure
Open the Bot to configure your username and other settings the Bot will need (see the Installation Guide or ReadMe for details.)
Run
That's it - now the Bot is ready to get going!
Requirements and Inputs
- Input data in CSV file
- Python 3.x installed in Bot Runner machine
- Python packages to be installed - numpy, pandas, matplotlib
Customer Reviews
