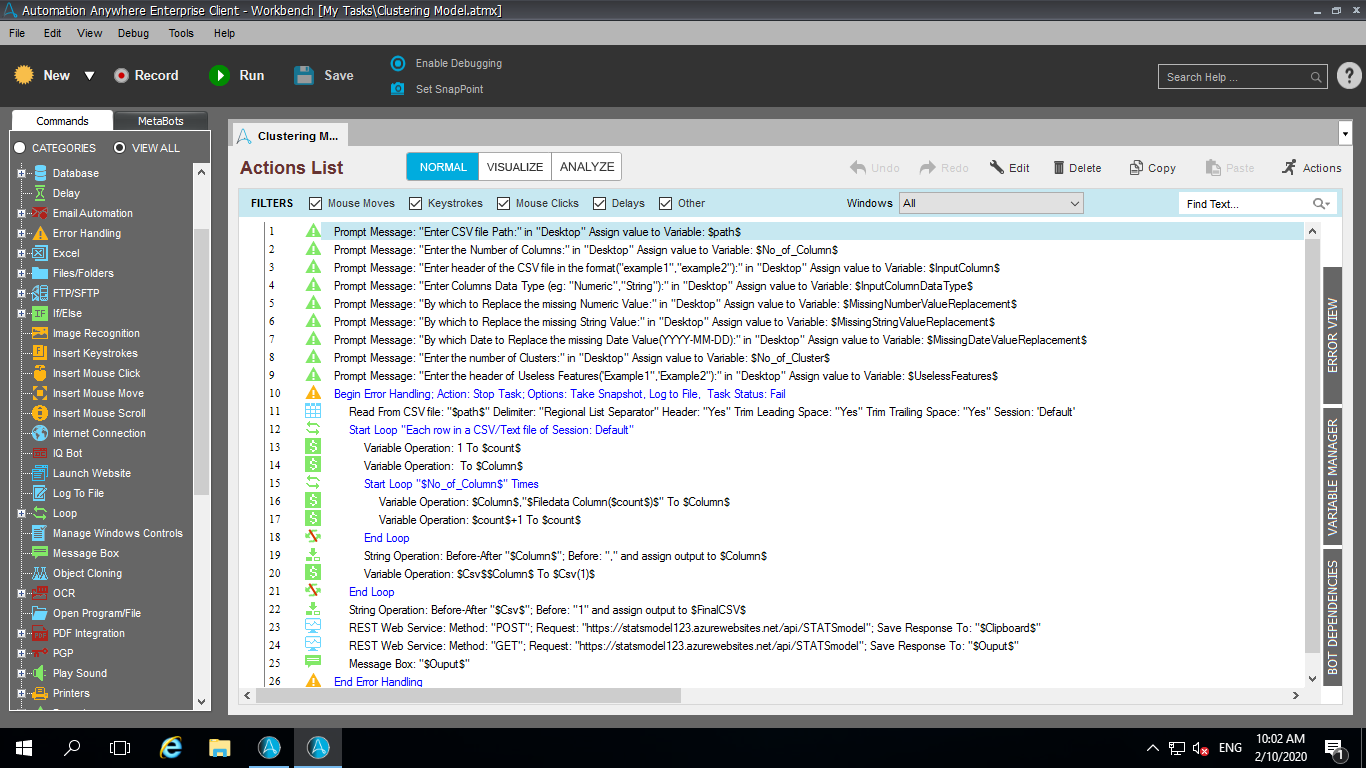
Impact Analysis Using Correlation Model
This bot performs a statistical parametric correlation operation among multiple numerical variables and provides the impact and degree of relationship.
Top Benefits
- Improve Decision Making: Better decision making for real world applications.
- Increase Productivity: Save 30% of time in the feature selection process and automation workflow creation.
- Zero Maintenance: Model is provided as SaaS using the serverless function architecture of Azure.
- Runs in Cloud: Model runs in Azure and provides output without needing an infrastructure to run.
- Ease of use: Model is easy to setup, highly scalable, and fault tolerant (Each request is independent of another request).
Tasks
- The correlation bot performs parametric 'Pearson correlation'.
- The bot provides correlation coefficients (r) among variables.
- The bot helps in understanding the extent of a relationship among numerical variables to make data-driven business decisions.
This bot performs a statistical parametric correlation operation among multiple numerical variables and provides the impact and degree of relationship.
Inputs:
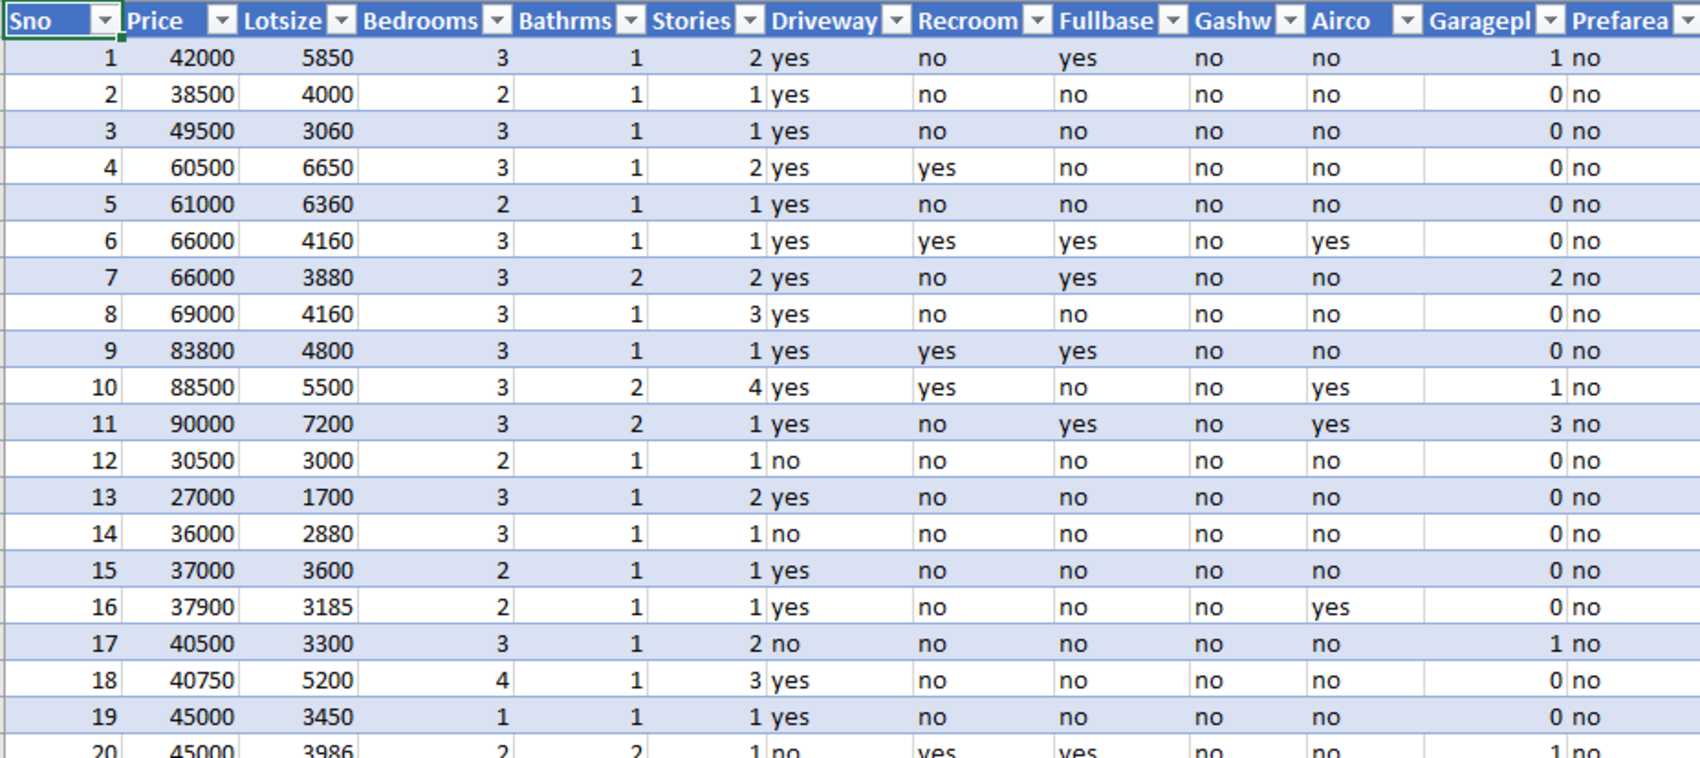
- Path: Path of the CSV file. For example: C:~Housing.csv
- Column Count: Count of columns available in CSV file being provided with input data.
- Input Column Names: Name of columns being provided in CSV file. For example 'SNo','Price','Lotsize','Bedrooms'......
- Input Column Data Type: Data Type of columns being provided in CSV file in the same order as column names. For example: 'Numeric','Numeric','Numeric'......
- Missing Number Value Replacement: A value that can be used by Model in case CSV file has blank field/s or missing numerical value/s.
- Ignore Columns: Column name that the model should ignore while calculating correlation. For example: 'SNo','Driveway','Recroom'......
Actions:
- The bot takes a CSV file as an input, performs a parametric correlation operation on numerical variables and provides output in Excel to exhibit the extent of a relationship (not causality).
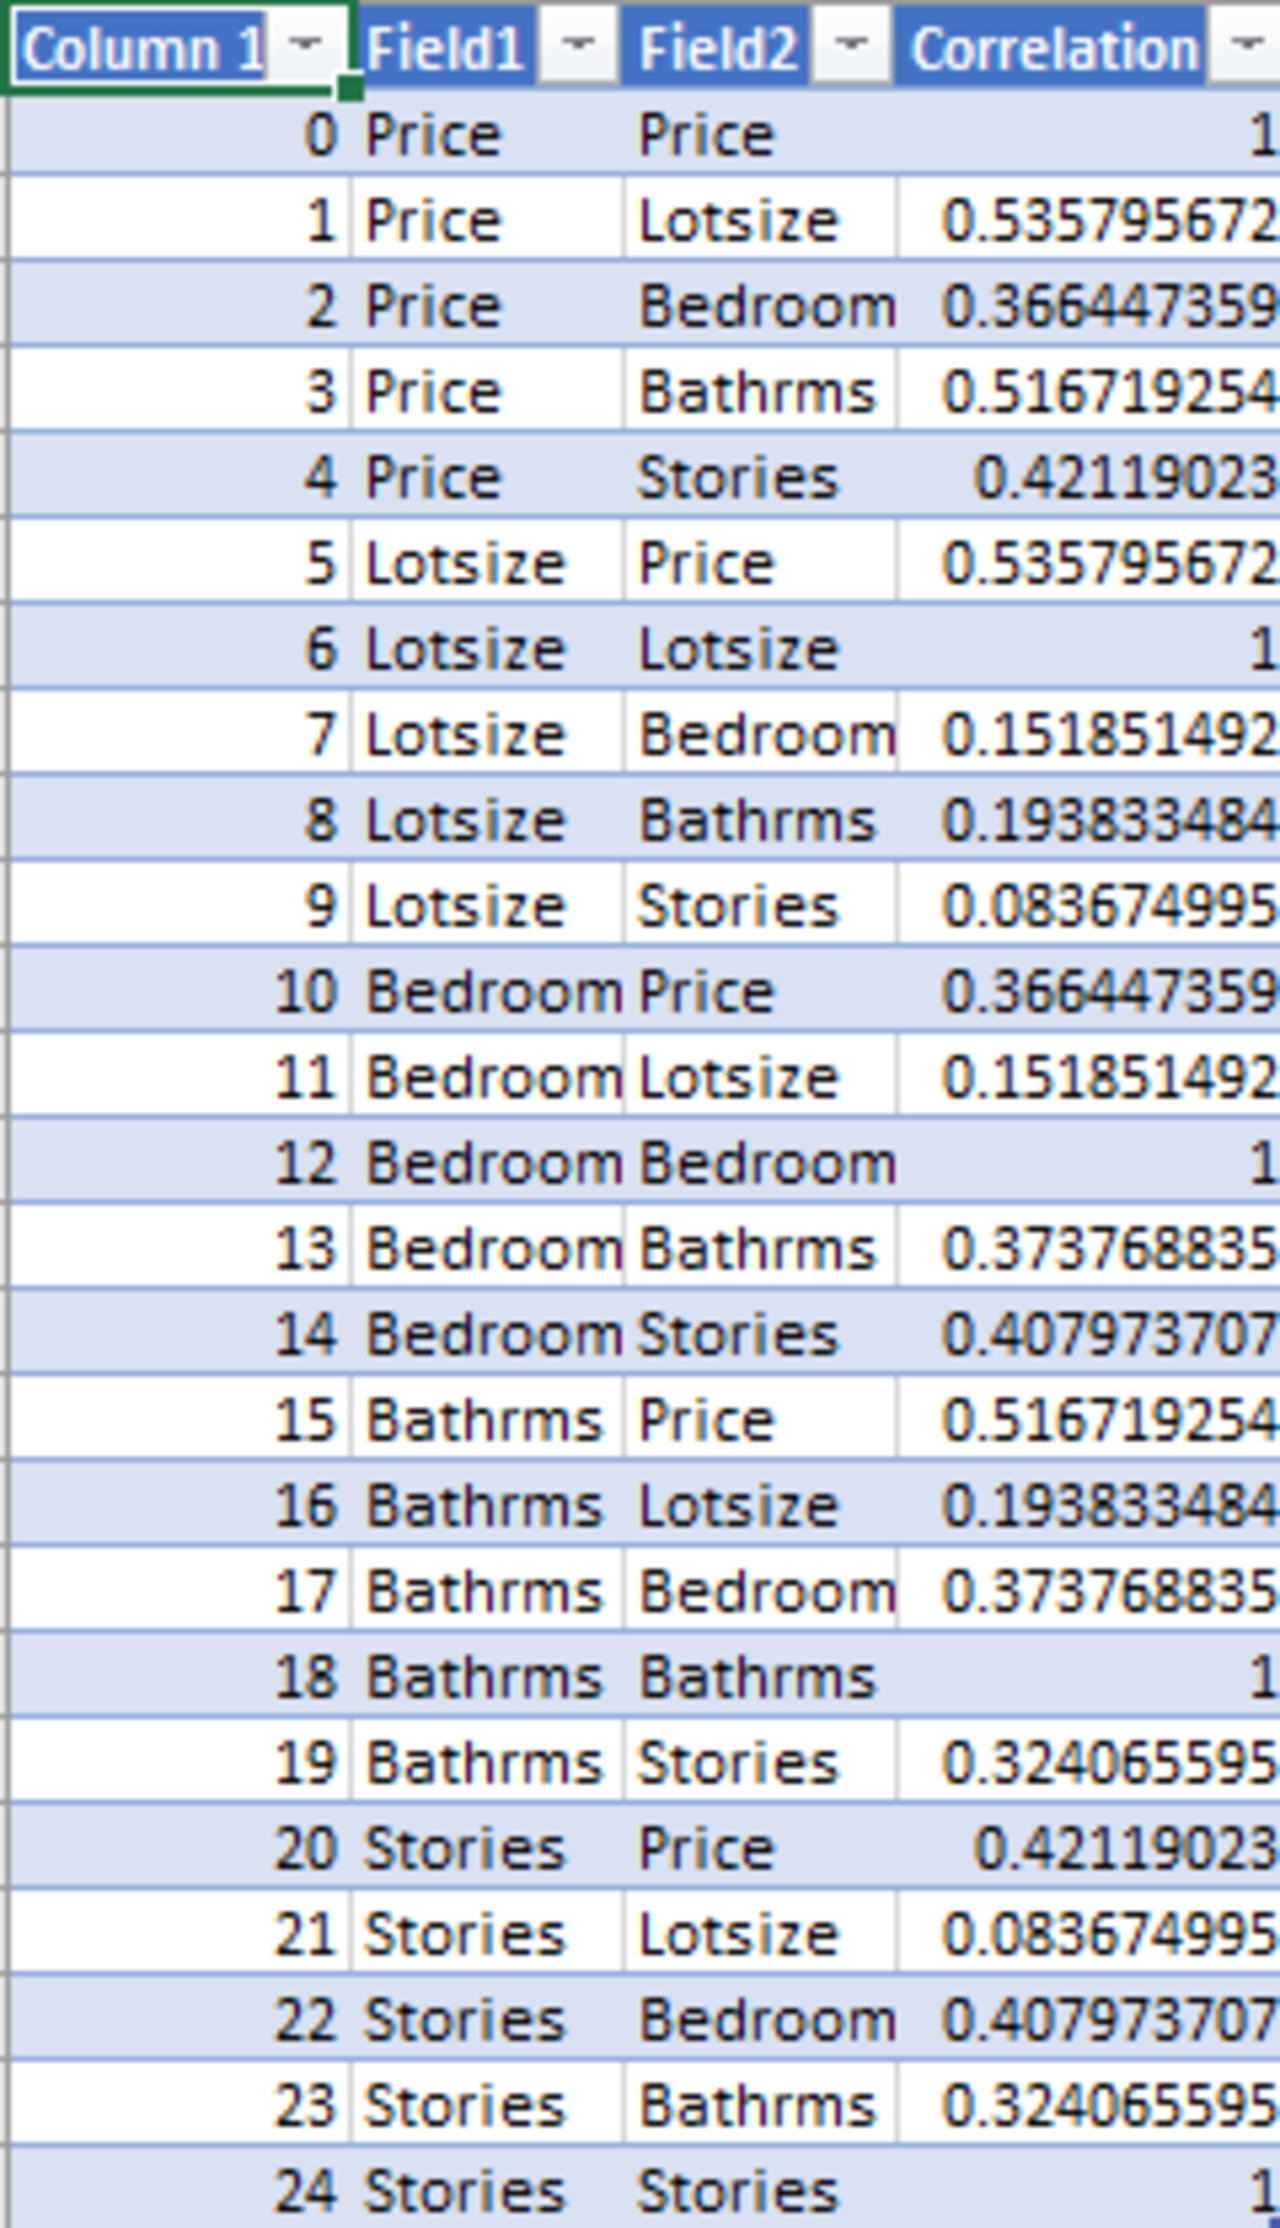
Outputs:
- Output: The result in Excel.
- Column field1 and field2 has the column names on which correlation has been processed.
- Column correlation has the extent of relationship for each combination.
Notes: Output correlation coefficients (r) for continuous (interval level) data ranges in a range of -1 to +1. Refer to readme file for more details.

Success
The download of Impact Analysis Using Correlation Model will begin shortly.
In your Control Room, use the ‘Import’ button to load the downloaded file into your Automations.
Free
- Applications
-


- Business Process
- Finance & AccountingInformation Technology
- Category
- Cognitive AutomationInsightsProductivity
- Downloads
- 18
- Vendor
-

- Automation Type
- Bot
- Last Updated
- December 11, 2020
- First Published
- April 9, 2020
- Platform
- 11.3
- Community Version
- 11.3.1
- ReadMe
- ReadMe
- Support
-
- Nextgen Invent Corporation
- Mon, Tue, Wed, Thu, Fri 9:00-17:00 UTC+0
- 508-753-1512
- bot.support@nextgeninvent.com
- Agentic App Store FAQs
- Bot Security Program
-
 Level 2
Bot Security
Level 2
- Includes Level 1 requirements.
- The automation development company attested that the automation was developed using software security controls and best practices.
- The automation developer completed a 3-part Automation Anywhere secure automation development training and passed corresponding tests.
Bot Security Program
Automation Anywhere Bot Security is the APA industry's first of its kind bot security framework. In partnership with cyber security experts, Bot Security encompasses four (4) progressive levels of security designation. All automations including those built in-house or procured from Agentic App Store, can now be deployed reliably with secure automation development practices in alignment with prevailing Confidentiality, Integrity, and Availability (CIA) cybersecurity principles and best practices. View full Bot Security details.
See the Bot in Action

Setup Process
Install
Download the Bot and follow the instructions to install it in your AAE Control Room.
Configure
Open the Bot to configure your username and other settings the Bot will need (see the Installation Guide or ReadMe for details.)
Run
That's it - now the Bot is ready to get going!
Requirements and Inputs
- Path of the CSV file.
Customer Reviews
